Policy
The WSIB has adopted the Ontario Rating Schedule (O.R.S.) as a clinical guide to evaluation, for consistency of medical assessment under the provisions of Sections 45(1), 45(3) and 13 of the Workers' Compensation Act, R.S.O, 1980. The Ontario Rating Schedule is used only as a guide for minimum rating levels for specified disabilities. It shows, in percentage, the approximate impairment of earnings capacity in an average unskilled worker. In every case, emphasis is placed on the individual factors being appraised and appropriate allowances are made.
Guidelines
Hand ratings
Four charts are provided for the rating of hand injuries. Each chart includes a diagram of a hand to identify the percentage of disability with the injured part.
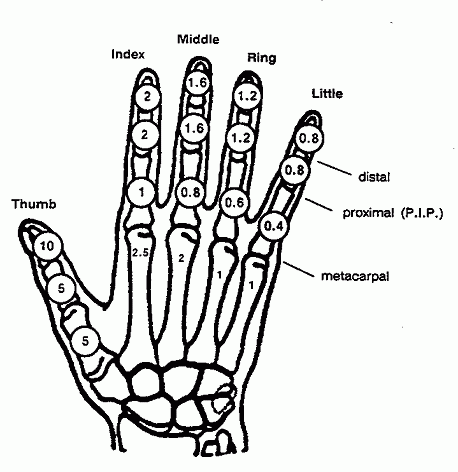
Chart 1 shows values for individual fingers and thumb when the disability involves more than one phalanx and the disability pertains to a single finger.
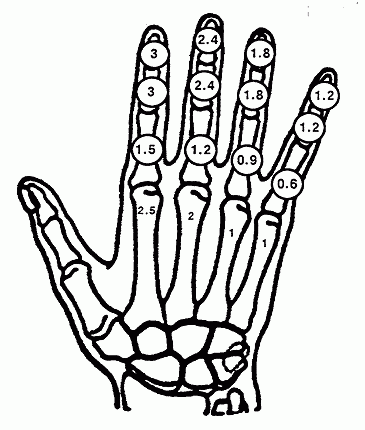
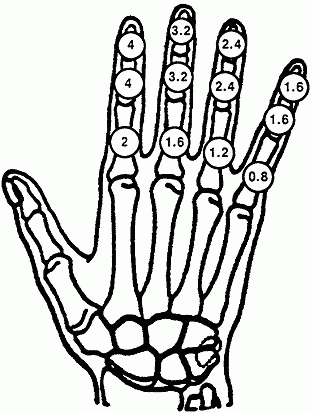
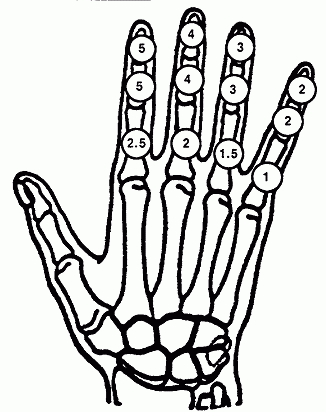
Charts 2, 3, and 4 are used if the disability pertains to more than one finger.
Thumb or Single Finger - Chart 1
Single Distal Phalanx
When the only disability involves a single distal phalanx of a finger or thumb, half the value in the following chart and illustration is used.
If less than a quarter of the second phalanx is lost, the rating is carried out as if the amputation was a distal phalanx only. The exception to this guideline is the thumb: In this case, judgment must be used to arrive at a reasonable figure having regard to the whole value of the digit, i.e., in the 5% to 10% range.
Metacarpals
The diagram which accompanies Chart 1 also provides disability rating values for metacarpals. The values shown do not include the thumb. The medical consultant uses the values shown as a minimum guide only, and assesses the function of the whole hand when establishing a disability rating.
More than one finger (Same hand) - Charts 2, 3, and 4
When calculating these, remember to apply the multiple only to those phalanges which are amputated or seriously impaired in common.
Percentage rating calculation
To determine the percentage rating of the disability when more than one finger is injured, the decision-maker or WSIB medical consultant applies the following formulae:
- 2 Finger disability = Sum of single digit value x 1.5
- 3 Finger disability = Sum of single digit value x 2
- 4 Finger disability = Sum of single digit value x 2.5
NOTE
When the thumb is involved on the same hand, the formula is:
finger(s) assessment + thumb assessment.
There is no multiple applied to a thumb rating, and a thumb disability does not increase the multiple factor applied in the finger(s) assessment.
Following from the application of these formulae, the percentage ratings for multiple finger injuries are provided and illustrated in charts 2 to 4.
| Amputation | Percentage |
|---|---|
| Thumb, including metacarpal | 20% |
| Thumb, both phalanges | 15% |
| Thumb, one phalanx | 10% |
| Finger, index | 5% |
| Finger, index at P.I.P. | 4% |
| Finger, index at distal | 2% |
| Finger, middle | 4% |
| Finger, middle at P.I.P. | 3.2% |
| Finger, middle at distal | 1.6% |
| Finger, ring | 3% |
| Finger, ring at P.I.P. | 2.4% |
| Finger, ring at distal | 1.2% |
| Finger, little | 2% |
| Finger, little at P.I.P. | 1.6% |
| Finger, little at distal | 0.8% |
NOTE
When the only disability involves a single distal phalanx the value is half that shown.
This diagram accompanies Chart 1
|
Amputation
|
Percentage |
|---|---|
| Index & middle at distal | 5.4% |
| Index & ring at distal | 4.8% |
| Index and little at distal | 4.2% |
| Middle & ring at distal | 4.2% |
| Middle & little at distal | 3.6% |
| Ring & little at distal | 3% |
| Index & middle at P.I.P. | 10.8% |
| Index & ring at P.I.P. | 9.6% |
| Index & little at P.I.P. | 8.4% |
| Middle & ring at P.I.P. | 8.4% |
| Middle & little at P.I.P. | 7.2% |
| Ring & little at P.I.P. | 6% |
| Index & middle at metacarpal | 13.5% |
| Index & ring at metacarpal | 12% |
| Index & little at metacarpal | 10.5% |
| Middle & ring at metacarpal | 10.5% |
| Middle & little at metacarpal | 9% |
| Ring & little at metacarpal | 7.5% |
This diagram accompanies Chart 2
| Amputation | Percentage |
|---|---|
| Index & middle with ring at distal | 9.6% |
| Index & middle with little at distal | 8.8% |
| Index & ring with little at distal | 8% |
| Middle & ring with little at distal | 7.2% |
| Index & middle with ring at P.I.P. | 19.2% |
| Index & middle with little at P.I.P. | 17.6% |
| Index & ring with little at P.I.P. | 16% |
| Middle & ring with little at P.I.P. | 14.4% |
| Index & middle with ring at metacarpal | 24% |
| Index & middle with little at metacarpal | 22% |
| Index & ring with little at metacarpal | 20% |
| Middle & ring with little at metacarpal | 18% |
This diagram accompanies Chart 3
| Amputation | Percentage |
|---|---|
| Index, middle, ring, & little at distal | 14% |
| Index, middle, ring, & little at P.I.P. | 28% |
| Index, middle, ring, & little at metacarpal | 35% |
This diagram accompanies Chart 4
Ankylosis of Joints
Fixation of a joint in the position of optimum function would warrant an award equal to one-half the value of the phalanx or phalanges distal to it. A finger or portion of a finger ankylosed in a very poor position may be assessed as if it were amputated.
The medical consultant estimates the loss of any portion of the movement range in between the two extremes cited in the preceding paragraph, using a value which is proportional to the disability rating for amputation.
| Immobility of joints | Percentage |
|---|---|
| Thumb, both joints | 7.5% |
| Thumb, distal joint | 2.5% |
| Finger, all joints | up to value of finger |
Multiples between hands or limbs - bilateral disability
If a worker is bilaterally disabled (e.g., disability to both knees) the formula applied is the sum of the disabilities in the individual limbs plus half the value of the lesser disability.
In calculating the rating for any permanent disability award, however, the decision-maker or WSIB medical consultant also considers the presence of any pre-existing condition which the worker had. The WSIB may include an enhancement factor in the worker's award, see 14-05-03, Second Injury and Enhancement Fund (SIEF).
| Upper extremity disability | Percentage |
|---|---|
| Amputations - proximal third of humerus or disarticulation of shoulder | 70% |
| Amputations - middle third of humerus | 65% |
| Amputations - distal third of humerus to biceps insertion | 60% |
| Amputations - biceps insertion to wrist (depending on usefulness of stump) | 50-60% |
| Immobility of joints - shoulder, without either articular or scapula movement (the totally "frozen" shoulder) | 35% |
| Immobility of joints - shoulder joint (gleno humeral) ankylosed but with full scapular movement | 15% |
| Immobility of joints - shoulder, abduction limited to 90 degrees but with good rotation and pivotal movement | 5% |
| Immobility of joints - elbow | 20% |
| Immobility of joints - wrist | 12.5% |
| Immobility of joints - pronation and supination complete in mid-position | 10% |
| Immobility of joints - pronation alone lost | 3% |
| Immobility of joints - supination alone lost | 5% |
| Denervation - median, complete at elbow | 40% |
| Denervation - median, complete at wrist | 20% |
| Denervation - ulnar, complete at elbow | 10% |
| Denervation - ulnar, complete at wrist | 8% |
| Lower extremity disability | Percentage |
|---|---|
| Amputations - hip disarticulation or short stump requiring an ischial bearing prosthesis | 65% |
| Amputations - thigh, site of election | 50% |
| Amputations - end bearing knee, or short below-knee stump, not suitable for a conventional below knee prosthesis | 45% |
| Amputations - leg, suitable for B.K. prosthesis | 35% |
| Amputations - leg, at ankle, end bearing | 25% |
| Amputations - through foot | 10-25% |
| Amputations - all toes | 5% |
| Amputations - toe, great | 2.5% |
| Amputations - toe, great at distal | 1% |
| Amputations - toes, other than great, each | 0.5% |
| Immobility of joints - hip | 30% |
| Immobility of joints - knee | 25% |
| Immobility of joints - knee, flexion limited to 90 degrees | 5% |
| Immobility of joints - ankle | 12% |
| Immobility of joints - great toe, both joints | 2.5% |
| Immobility of joints - great toe, distal joint | 0.5% |
| Shortening of leg - 1 inch | 1.5% |
| Shortening of leg - 2 inches | 6% |
| Shortening of leg - 3 inches | 15% |
| Denervation - peroneal, complete | 12% |
| Location | Percentage |
|---|---|
| Total immobility of spine (usual distribution) | 60% |
| Cervical and/or thoracic | 30% |
|
Lumbar and/or lumbosacral |
30% |
| Location | Percentage |
|---|---|
| Loss of one kidney | 10% |
Impairment of vision in one eye or both
Permanent disability rating is done following optical correction with spectacles/contact lenses.
| Impairment of vision | Percentage |
|---|---|
| Enucleation | 18% |
| Sight of one eye | 16% |
| Cataract | 12% |
| Hemianopia, right field | 25% |
| Hemianopia, left field | 20% |
| Diplopia, all fields | 10% |
| Scotomata, depending on location and extent | Up to 16% |
| Aphakic eye | Percentage |
|---|---|
| 20/20, 20/30 | 6% |
| 20/40 | 7% |
| 20/50 | 8% |
| 20/60 | 9% |
| 20/80 | 10% |
| 20/100 | 11% |
| 20/200 | 12% |
| Partial visual loss Snellen test result | Percentage |
|---|---|
| 20/30 | 0% |
| 20/40 | 1% |
| 20/50 | 2% |
| 20/60 | 4% |
| 20/80 | 6% |
| 20/100 | 8% |
| 20/200 | 12% |
| 20/400 | 14% |
NOTE
Results of Snellen test for distance are after correction with conventional eye glasses.
If one eye is enucleated, the WSIB adds 2% to the degree of permanent disability obtained, since the loss of sight in one eye is 16% and the enucleation is 18%.
When a worker, already blind in one eye, also becomes blind in the remaining sighted eye for a compensable reason, the WSIB awards a disability rating of 100%. For information concerning accident cost charges, see 14-05-03, Second Injury and Enhancement Fund (SIEF).
| Loss of sight | Percentage |
|---|---|
| Loss of sight in one eye | 16% |
| Enucleation | 18% |
| Loss of sight in both eyes | 100% |
For loss of vision in both eyes following correction, use the table below:
- For one eye, find level of visual acuity on vertical axis.
- For the other eye, find level of visual acuity on horizontal axis.
- The intersection of both axes equals the percentage of permanent disability.
For loss of vision in one eye following correction, use the table below:
- Find level of visual acuity on vertical axis.
- Look in next column to find the percentage of permanent disability.
| Snellen scale |
20/30 6/9 |
20/40 6/12 |
20/50 6/15 |
20/60 6/18 |
20/80 6/24 |
20/100 6/30 |
20/200 6/60 |
20/400 6/120 |
Blind |
|---|---|---|---|---|---|---|---|---|---|
|
20/30 6/9 |
0% | 1% | 2% | 4% | 6% | 8% | 12% | 14% | 16% |
|
20/40 6/12 |
1% | 6.3% | 7.3% | 9.3% | 11.3% | 13.3% | 17.3% | 19.3% | 21.3% |
|
20/50 6/15 |
2% | 7.3% | 12.5% | 14.5% | 16.5% | 18.5% | 22.5% | 24.5% | 26.5% |
|
20/60 6/18 |
4% | 9.3% | 14.5% | 25% | 27% | 29% | 33% | 35% | 37% |
|
20/80 6/24 |
6% | 11.3% | 16.5% | 27% | 37.5% | 39.5% | 43.5% | 45.5% | 47.5% |
|
20/100 6/30 |
8% | 13.3% | 18.5% | 29% | 39.5% | 50% | 54% | 56% | 58% |
|
20/200 6/60 |
12% | 17.3% | 22.5% | 33% | 43.5% | 54% | 75% | 77% | 79% |
|
20/400 6/120 |
14% | 19.3% | 24.5% | 35% | 45.5% | 56% | 77% | 87.5% | 89.5% |
| Blind | 16% | 21.3% | 26.5% | 37% | 47.5% | 58% | 79% | 89.5% | 100% |
Application date
This policy applies to all decisions made on or after June 1, 2023, for accidents prior to January 2, 1990.
Document history
This policy replaces 18-07-02 dated October 12, 2004.
This document was previously published as:
05-03-03 dated August 1, 2003.
References
Legislative authority
Workers' Compensation Act, R.S.O. 1980, as amended
Sections 13, 45(1), 45(3)
Minute
Administrative
#8, May 25, 2023, page 617


